02 — Selected Projects
Stories
in code & pixels.
A mix of editorial graphics, interactive explainers, and animated scrollytelling — published at CGTN, Reuters, Kontinentalist, and as personal projects.
Personal · 2023
Personal viz
Visualizing my exercise in 2023.
CGTN · 2022
Editorial
The numbers of a decade — China's modernization.
CGTN · 2021
Summer Olympics — the biggest winners.
CGTN · 2021
Scrollytelling
Tianwen-1 to Mars — China's first interplanetary mission, told frame by frame.
Kontinentalist
A cultural history of Han Chinese names.

Reuters · Contributor
Reopening a megacity — Wuhan after lockdown.
Reuters
Alibaba's "Double 11" — the world's largest online retail event.
Reuters
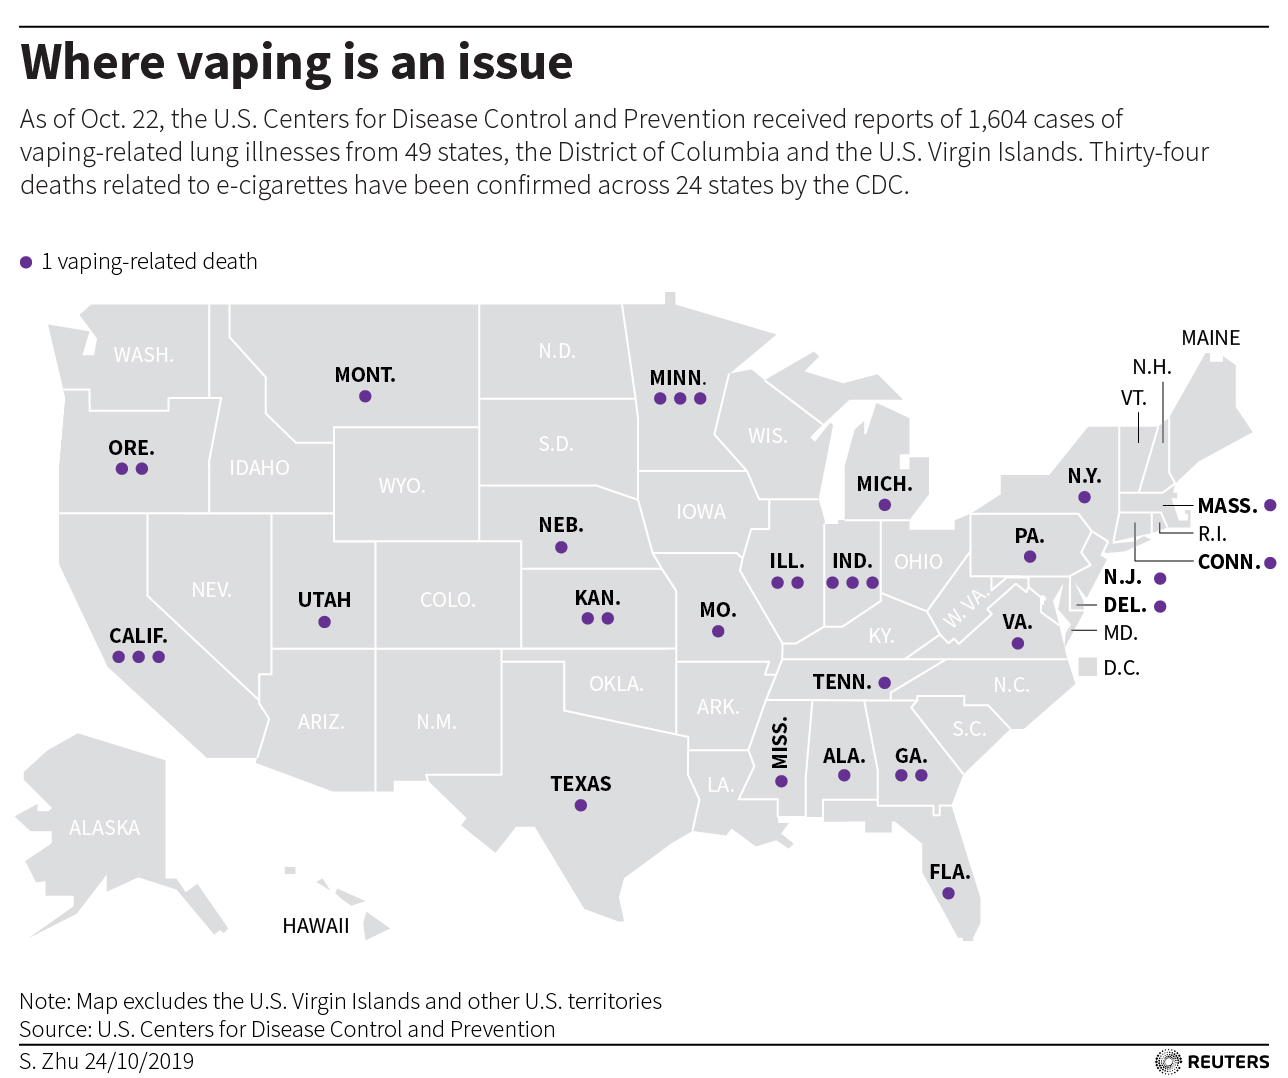
America's vaping crisis, mapped.
Reuters
Apple products made in China could face tariffs by year's end.
Reuters · EN/CN
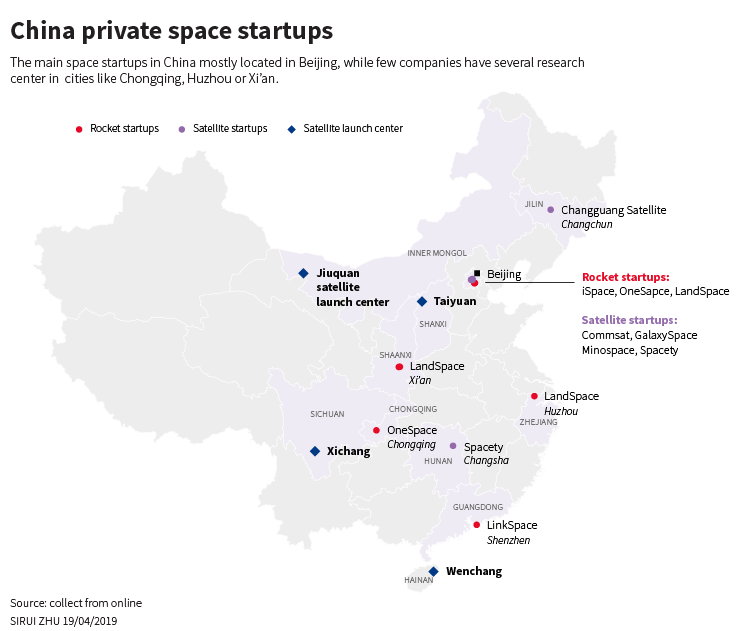
China's Long March to space — a 50-year story.
Reuters · Illustration
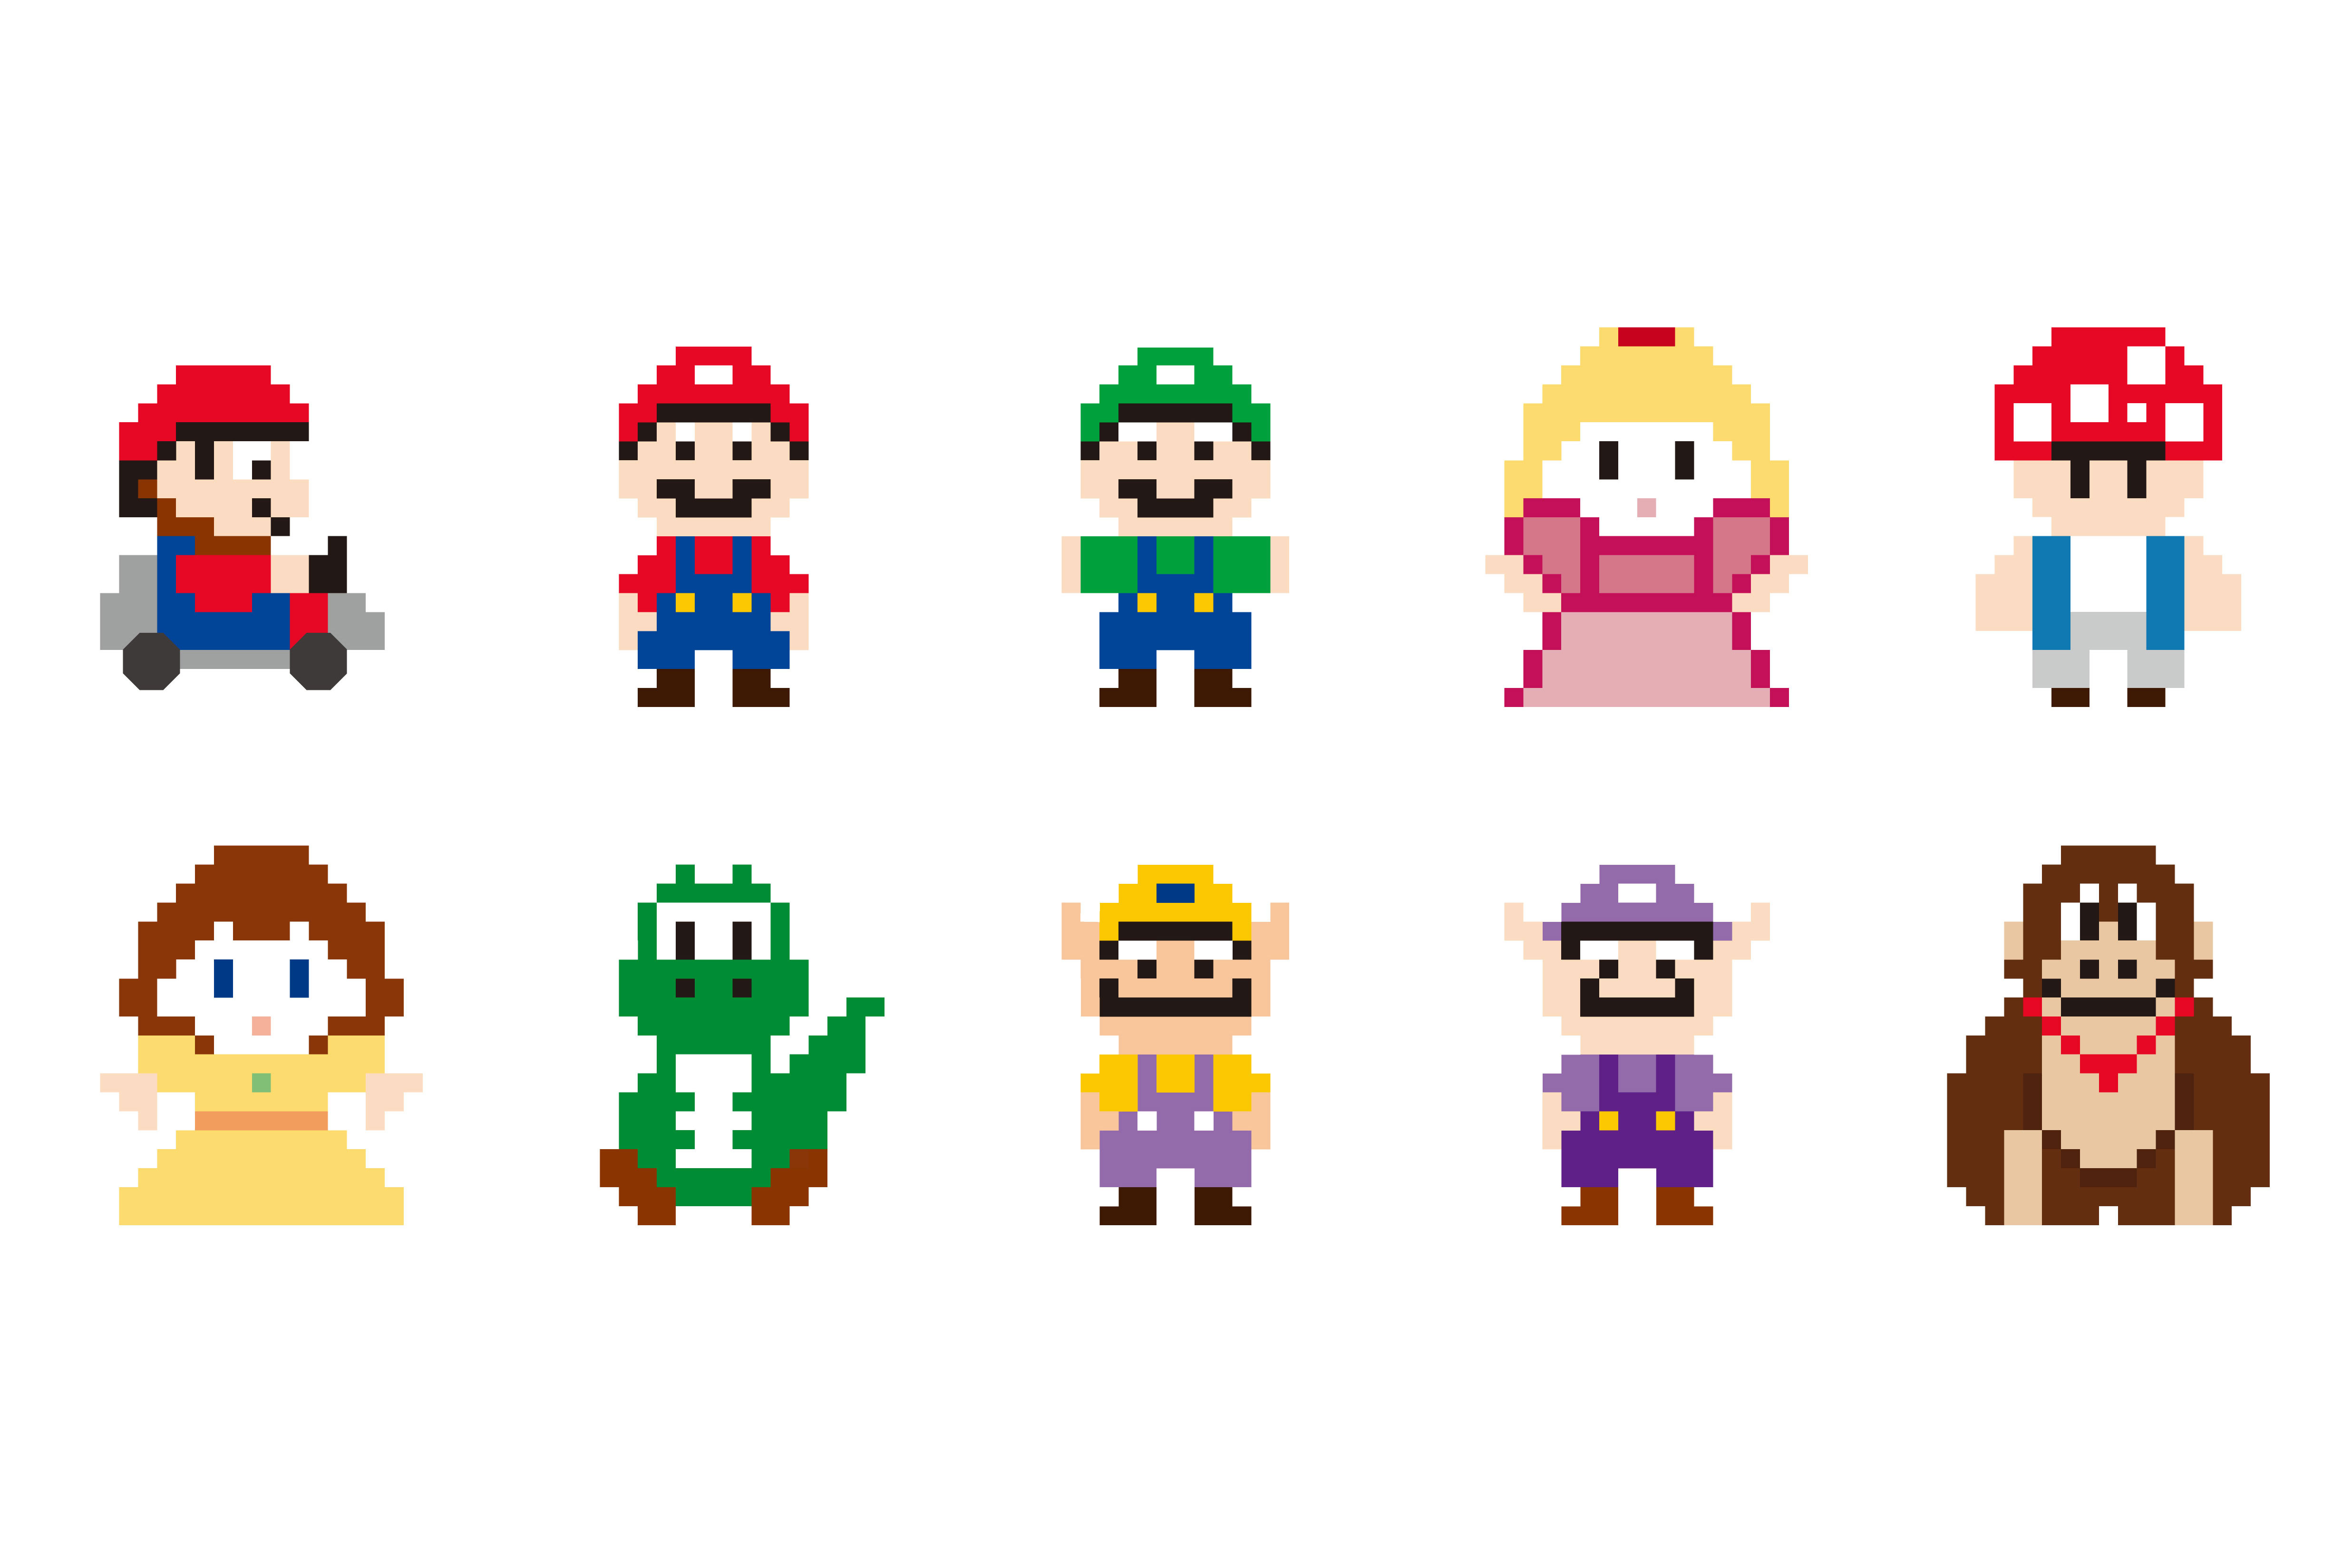
Mario Kart goes mobile.
Reuters
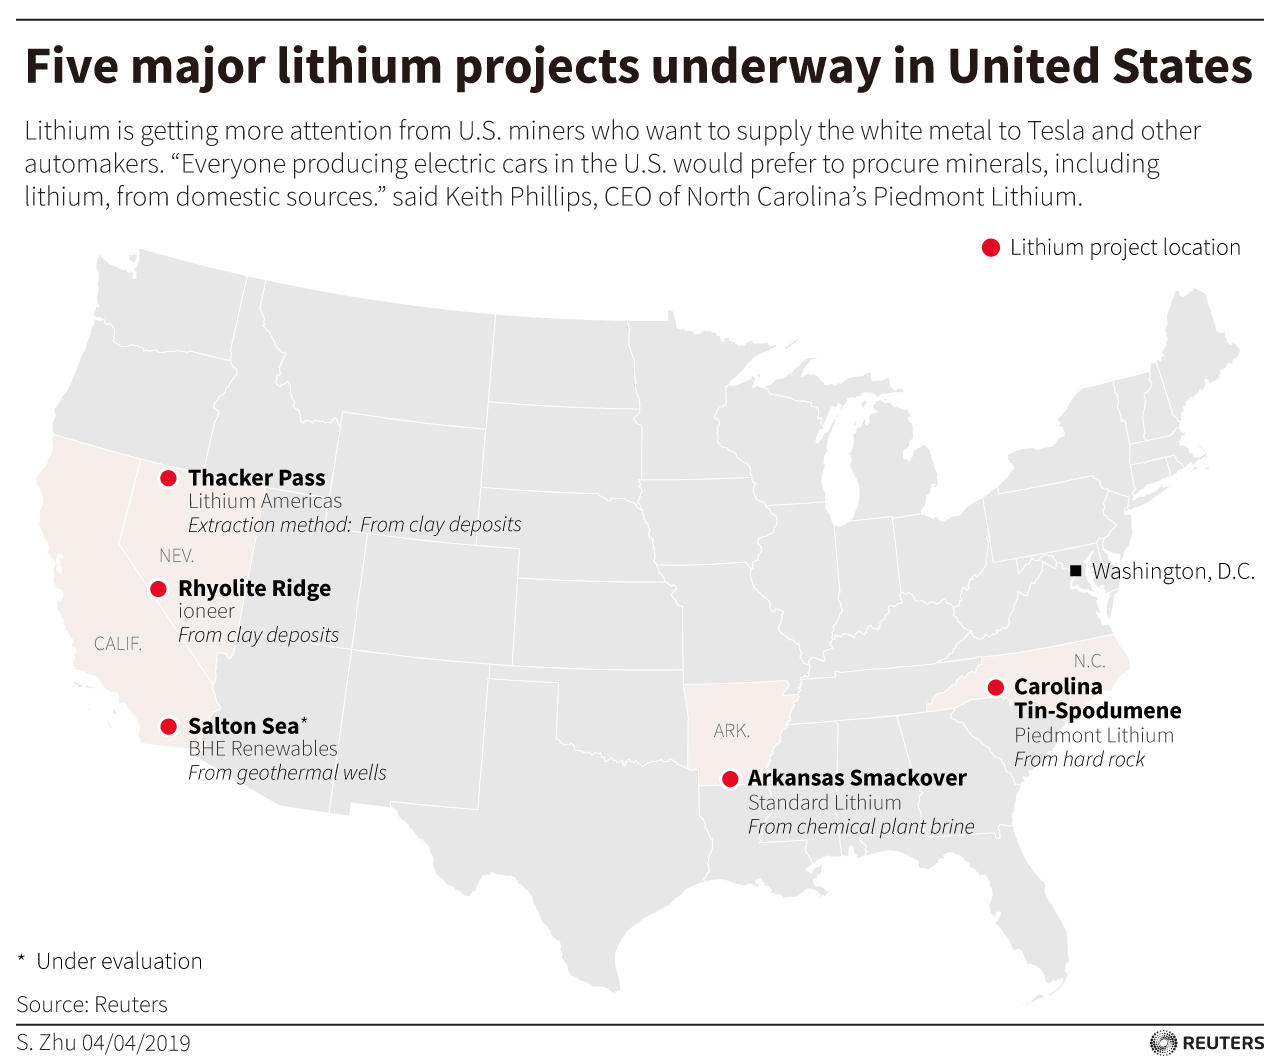
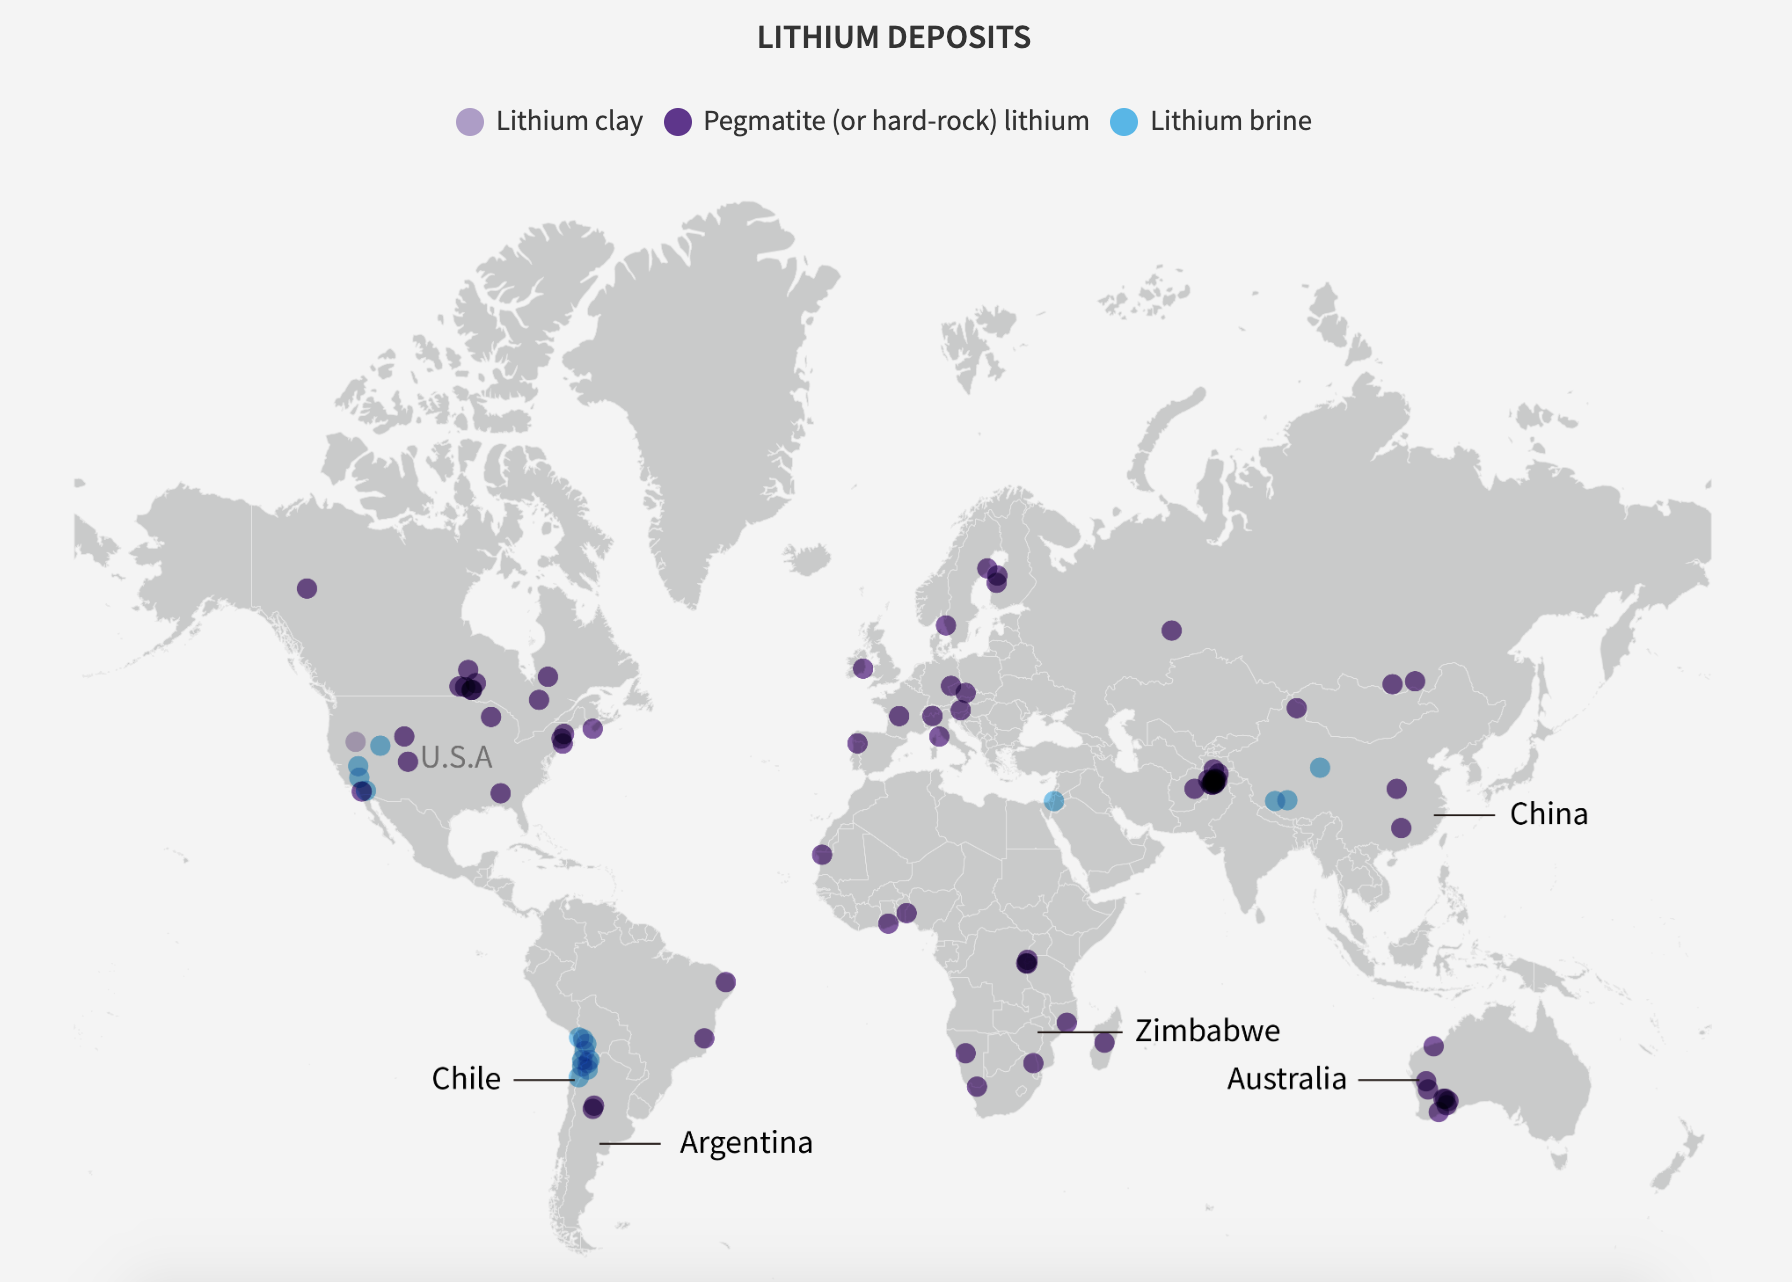
Game of Mines — EV metals rush.
Reuters
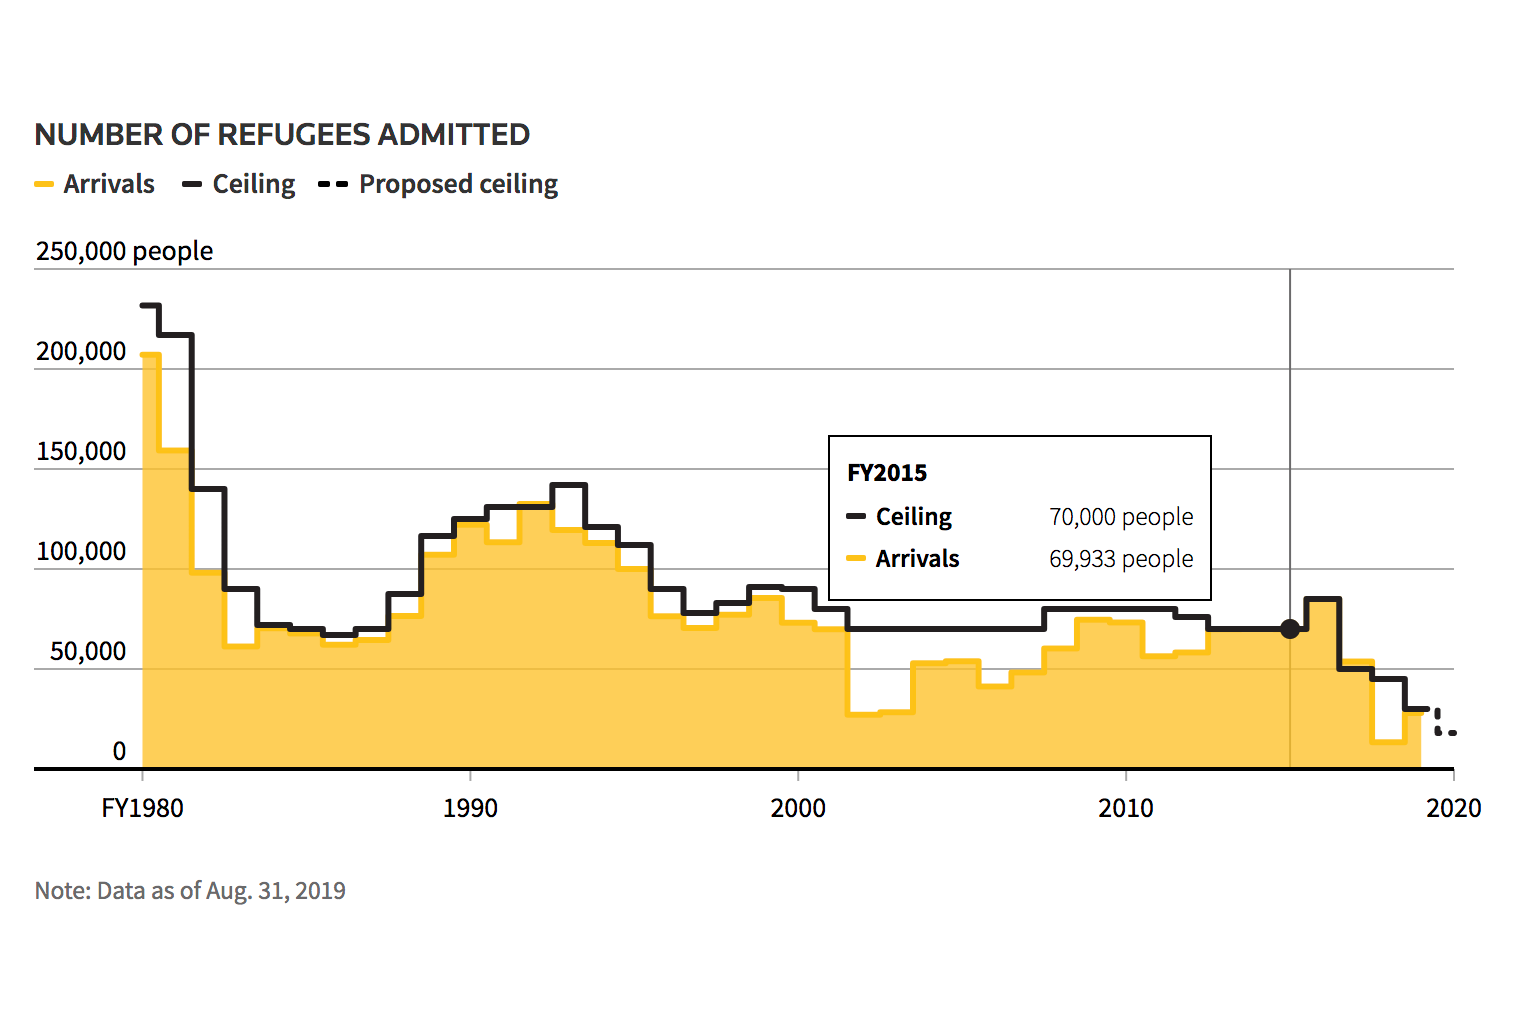
Shrinking refuge — U.S. refugee admissions.
Reuters
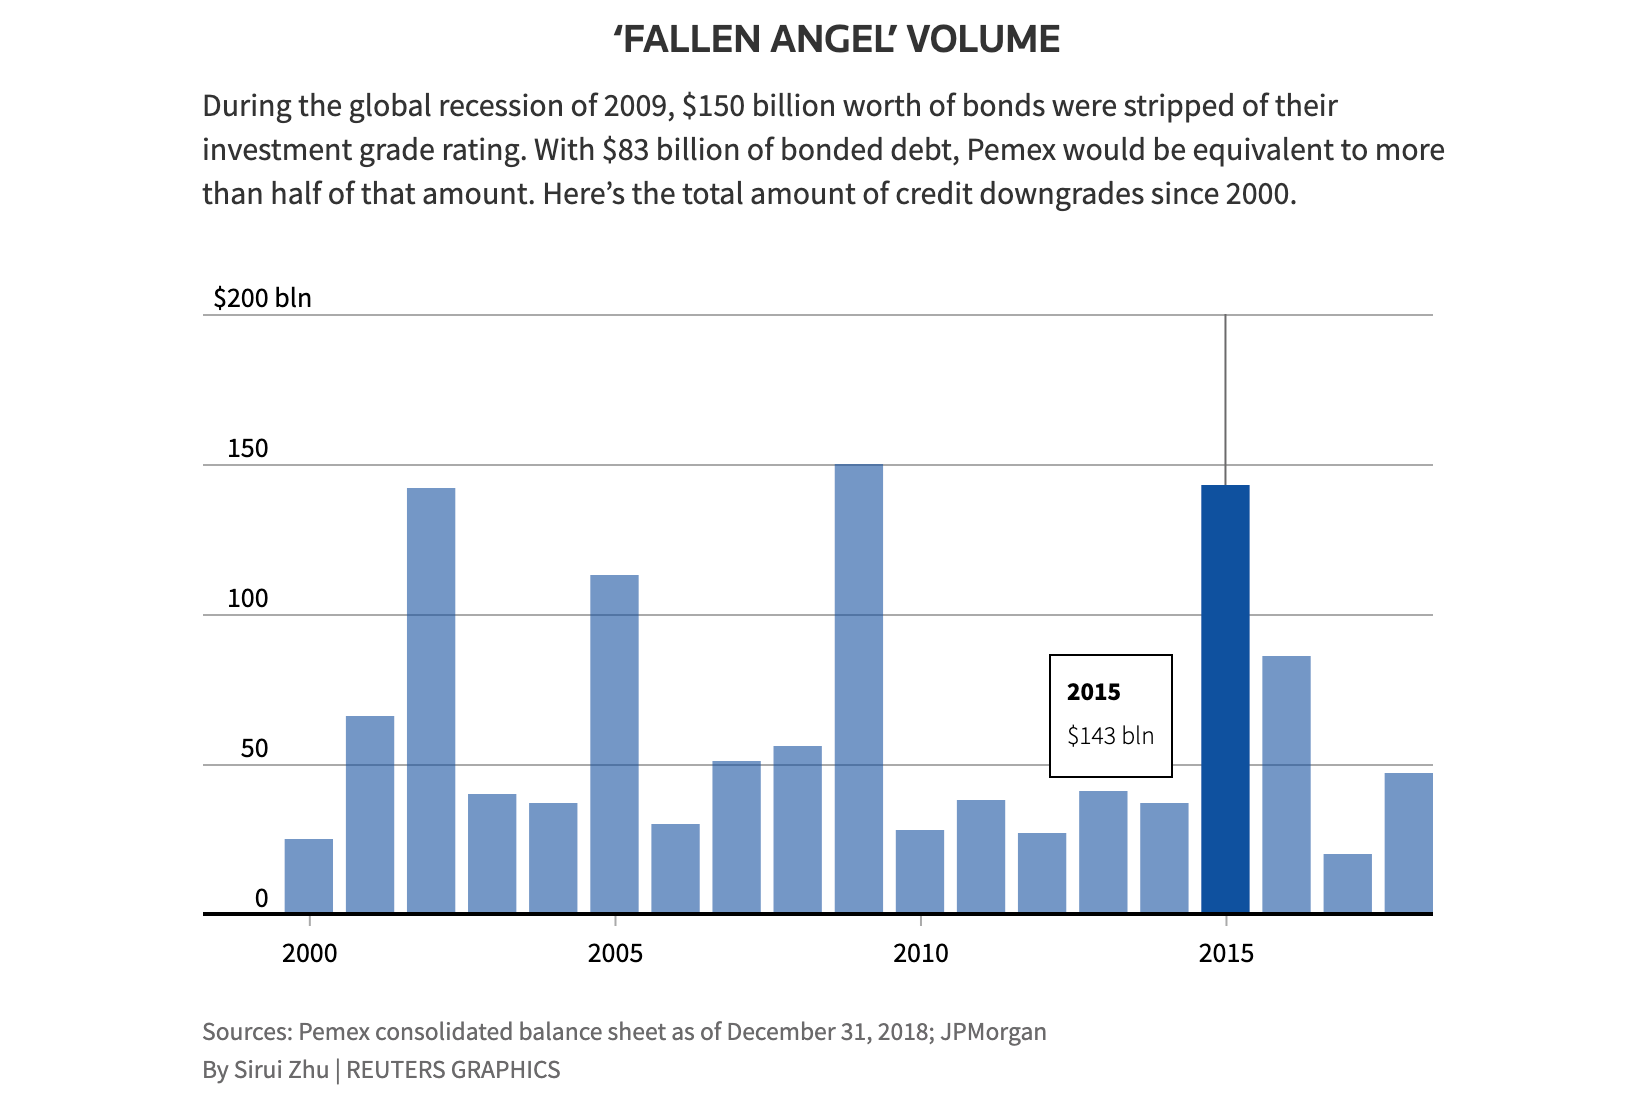
Pemex's massive debt.
Reuters
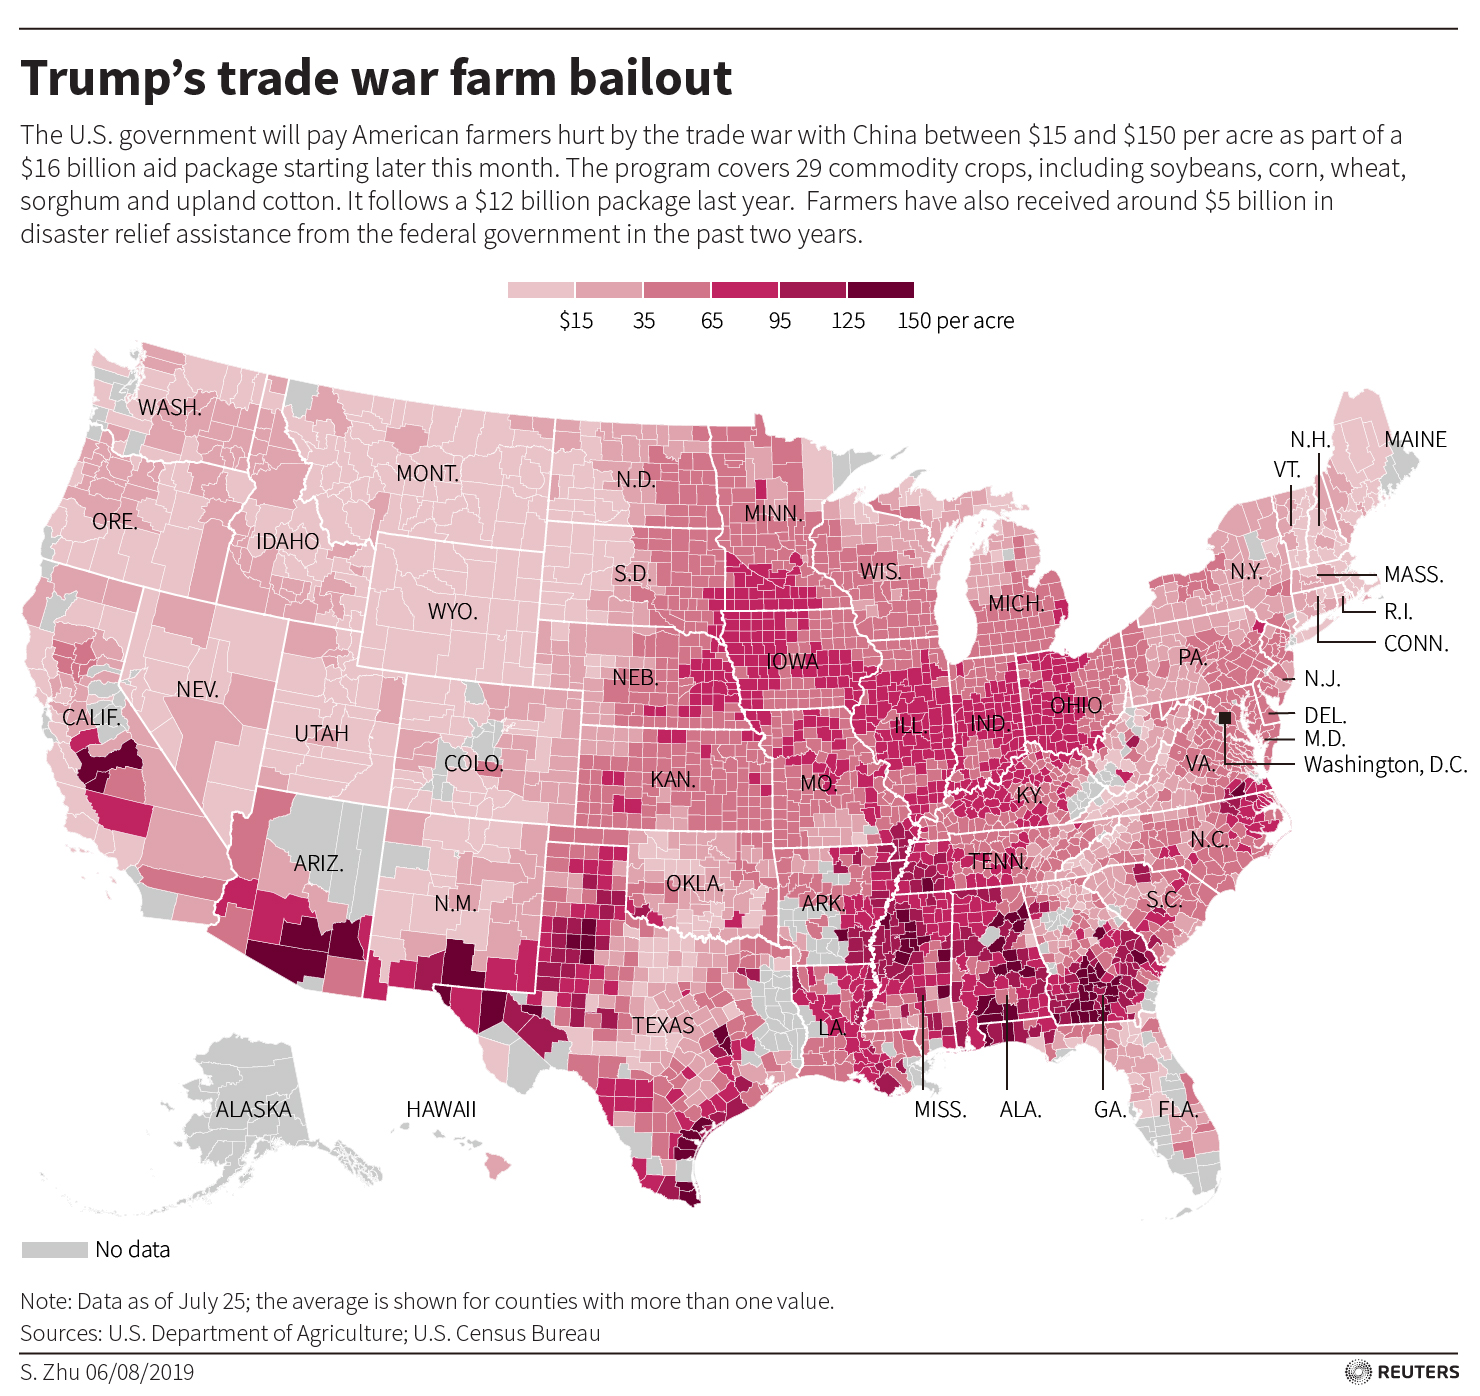
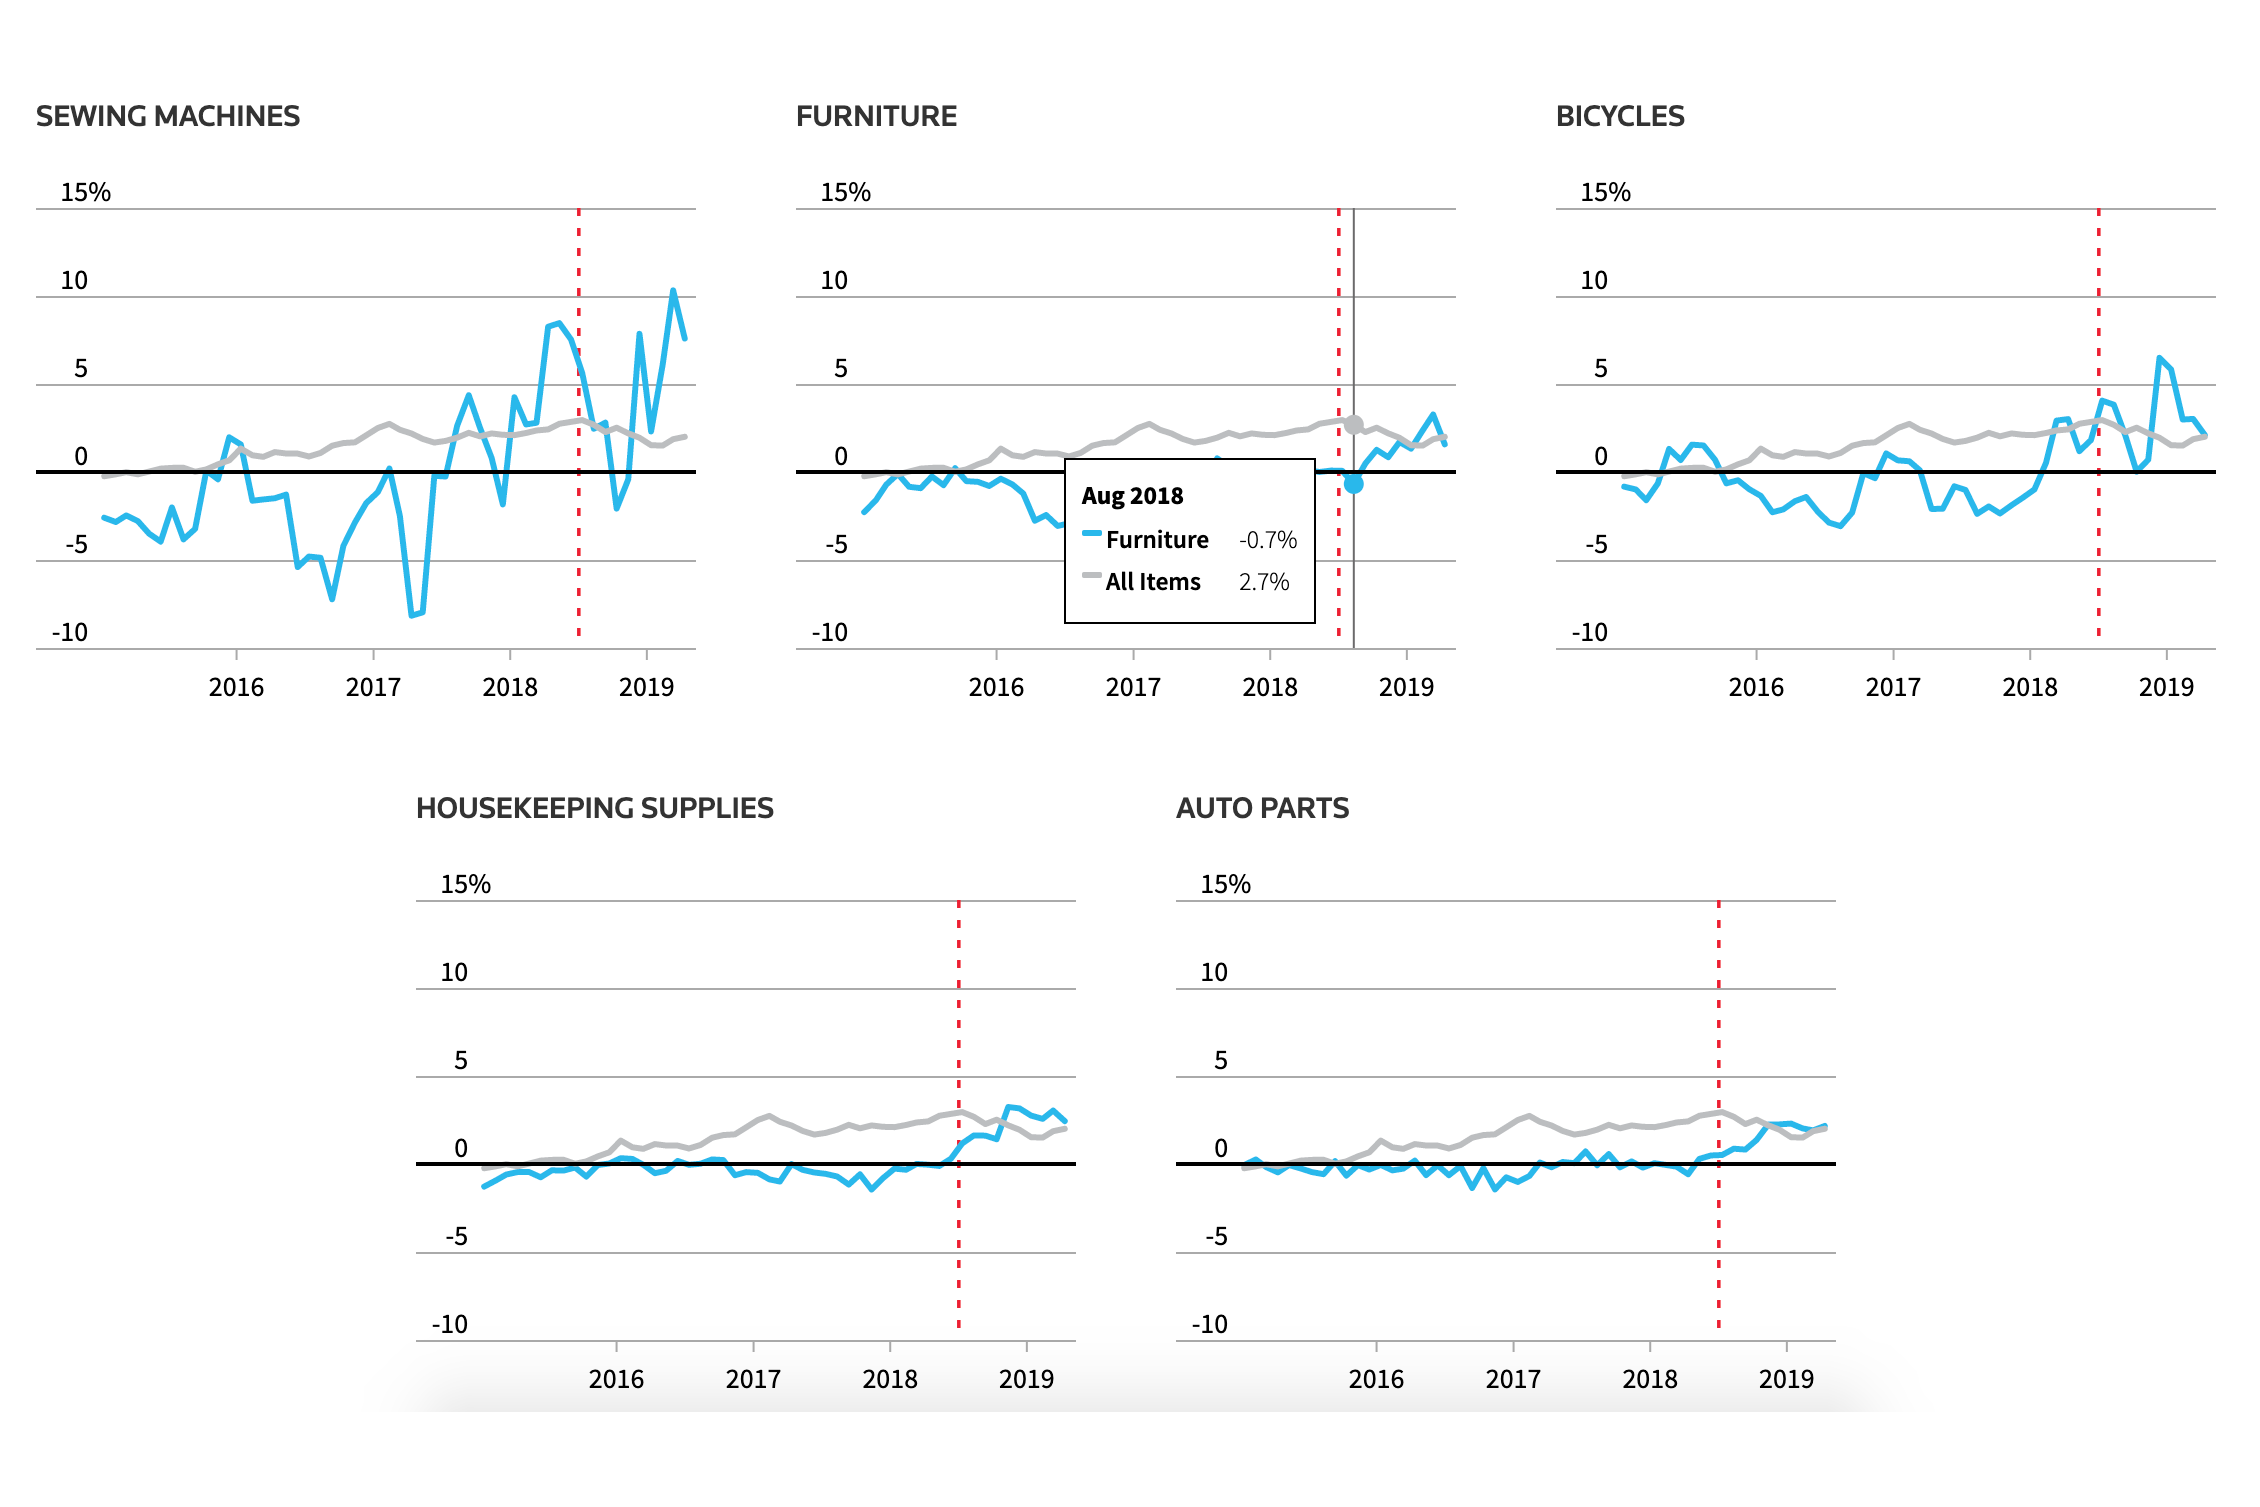
USA–China tariff timeline.
Personal · 2019
Treasure of architecture — China to better protect cultural relics.
Personal
Finding home — 50 years of refugee crisis.
Personal
Hollywood age gap — on-screen romance.
Personal
What do critics think of Asian movies?
Stack —
JavaScript
D3.js
Leaflet
Mapbox
QGIS
Python
Pandas
Matplotlib
Selenium
BeautifulSoup
Illustrator
After Effects